Import libraries
import pandas as pdimport sslfrom functools import reduce from sklearn.model_selection import train_test_splitfrom sklearn.metrics import accuracy_score, classification_reportfrom sklearn.preprocessing import LabelEncoder= ssl._create_unverified_context'display.max_columns' , None )
Load auditions data
= pd.read_csv('https://raw.githubusercontent.com/rfordatascience/tidytuesday/master/data/2024/2024-07-23/auditions.csv' , encoding= 'unicode_escape' )5 )
0
1
2002-04-20
2002-04-22
Los Angeles, California
Westin Bonaventure Hotel
NaN
11-Jun-02
NaN
NaN
NaN
31.0
NaN
1
1
2002-04-23
2002-04-25
Seattle, Washington
Hyatt Regency Hotel
NaN
11-Jun-02
NaN
NaN
NaN
10.0
NaN
2
1
2002-04-26
2002-04-28
Chicago, Illinois
Congress Plaza Hotel
NaN
11-Jun-02
NaN
NaN
NaN
23.0
NaN
3
1
2002-04-29
2002-05-01
New York City, New York
Millenium Hilton Hotel
NaN
11-Jun-02
NaN
NaN
NaN
25.0
NaN
4
1
2002-05-03
2002-05-05
Atlanta, Georgia
AmericasMart/Callanwolde Fine Arts Center
NaN
11-Jun-02
NaN
2002-03-05
2002-03-05
15.0
NaN
Load eliminations data
= pd.read_csv('https://raw.githubusercontent.com/rfordatascience/tidytuesday/master/data/2024/2024-07-23/eliminations.csv' , encoding= 'unicode_escape' )5 )
0
1
1
Female
Kelly Clarkson
NaN
NaN
NaN
NaN
NaN
NaN
NaN
NaN
NaN
Safe (2nd)
NaN
NaN
NaN
NaN
NaN
NaN
NaN
NaN
NaN
NaN
NaN
NaN
NaN
NaN
NaN
NaN
NaN
Safe
NaN
NaN
Safe
NaN
Safe
NaN
Safe
NaN
Safe
NaN
Safe
NaN
Safe
Winner
1
1
2
Male
Justin Guarini
NaN
NaN
NaN
NaN
NaN
NaN
NaN
NaN
NaN
Safe (1st)
NaN
NaN
NaN
NaN
NaN
NaN
NaN
NaN
NaN
NaN
NaN
NaN
NaN
NaN
NaN
NaN
NaN
Safe
NaN
NaN
Safe
NaN
Bottom Two
NaN
Safe
NaN
Safe
NaN
Safe
NaN
Safe
Runner-Up
2
1
3
Female
Nikki McKibbin
NaN
NaN
NaN
NaN
NaN
NaN
NaN
NaN
NaN
NaN
Safe (2nd)
NaN
NaN
NaN
NaN
NaN
NaN
NaN
NaN
NaN
NaN
NaN
NaN
NaN
NaN
NaN
NaN
Bottom Three
NaN
NaN
Safe
NaN
Bottom Three
NaN
Bottom Three
NaN
Bottom Two
NaN
Bottom Two
NaN
Eliminated
NaN
3
1
4
Female
Tamyra Gray
NaN
NaN
NaN
NaN
NaN
NaN
NaN
NaN
Safe (1st)
NaN
NaN
NaN
NaN
NaN
NaN
NaN
NaN
NaN
NaN
NaN
NaN
NaN
NaN
NaN
NaN
NaN
NaN
Safe
NaN
NaN
Safe
NaN
Safe
NaN
Safe
NaN
Safe
NaN
Eliminated
NaN
NaN
NaN
4
1
5
Male
R. J. Helton
NaN
NaN
NaN
NaN
NaN
NaN
NaN
NaN
NaN
NaN
Wild Card
NaN
NaN
NaN
NaN
NaN
NaN
NaN
NaN
NaN
NaN
NaN
NaN
NaN
NaN
Saved
NaN
Safe
NaN
NaN
Safe
NaN
Safe
NaN
Bottom Two
NaN
Eliminated
NaN
NaN
NaN
NaN
NaN
Load finalists data
= pd.read_csv('https://raw.githubusercontent.com/rfordatascience/tidytuesday/master/data/2024/2024-07-23/finalists.csv' , encoding= 'unicode_escape' )5 )
0
Kelly Clarkson
24-Apr-82
Fort Worth, Texas
Burleson, Texas
She performed Aretha Franklin's version of "Re...
1
1
Justin Guarini
28-Oct-78
Columbus, Georgia
Doylestown, Pennsylvania
He performed Oleta Adams' version of "Get Her...
1
2
Nikki McKibbin
28-Sep-78
Grand Prairie, Texas
NaN
She had previously been on Popstars and auditi...
1
3
Tamyra Gray
26-Jul-79
Takoma Park, Maryland
Atlanta, Georgia
She had appeared on TV commercials and worked ...
1
4
R. J. Helton
17-May-81
Pasadena, Texas
Cumming, Georgia
J. Helton (born May 17, 1981, in Pasadena, Tex...
1
Load ratings data
= pd.read_csv('https://raw.githubusercontent.com/rfordatascience/tidytuesday/master/data/2024/2024-07-23/ratings.csv' , encoding= 'unicode_escape' )5 )
0
1
1
Auditions
June 11, 2002
4.8
9.85
NaN
NaN
NaN
NaN
NaN
12
NaN
NaN
NaN
NaN
6.1 / 11
1
1
2
Hollywood Week
June 12, 2002
5.2
11.24
NaN
NaN
NaN
NaN
NaN
6
NaN
NaN
NaN
NaN
6.9 / 12
2
1
3
Top 30: Group 1
June 18, 2002
5.2
10.30
NaN
NaN
NaN
NaN
NaN
6
NaN
NaN
NaN
NaN
6.2 / 11
3
1
4
Top 30: Group 1 results
June 19, 2002
4.7
9.47
NaN
NaN
NaN
NaN
NaN
22
NaN
NaN
NaN
NaN
5.8 / 10
4
1
5
Top 30: Group 2
June 25, 2002
4.5
9.08
NaN
NaN
NaN
NaN
NaN
11
NaN
NaN
NaN
NaN
5.5 / 9
Load seasons data
= pd.read_csv('https://raw.githubusercontent.com/rfordatascience/tidytuesday/master/data/2024/2024-07-23/seasons.csv' , encoding= 'unicode_escape' )5 )
0
1
Kelly Clarkson
Justin Guarini
June 11 (2002-06-11) –September 4, 2002 (...
Fox
Ryan Seacrest; Brian Dunkleman
Paula Abdul; Simon Cowell; Randy Jackson
NaN
Kodak Theatre
NaN
1
2
Ruben Studdard
Clay Aiken
January 21 (2003-01-21) –May 21, 2003 (20...
Fox
Ryan Seacrest
Paula Abdul; Simon Cowell; Randy Jackson
NaN
Gibson Amphitheatre
NaN
2
3
Fantasia Barrino
Diana DeGarmo
January 19 (2004-01-19) –May 26, 2004 (20...
Fox
Ryan Seacrest
Paula Abdul; Simon Cowell; Randy Jackson
NaN
Kodak Theatre
NaN
3
4
Carrie Underwood
Bo Bice
January 18 (2005-01-18) –May 25, 2005 (20...
Fox
Ryan Seacrest
Paula Abdul; Simon Cowell; Randy Jackson
NaN
Kodak Theatre
NaN
4
5
Taylor Hicks
Katharine McPhee
January 17 (2006-01-17) –May 24, 2006 (20...
Fox
Ryan Seacrest
Paula Abdul; Simon Cowell; Randy Jackson
NaN
Kodak Theatre
NaN
Load songs data
= pd.read_csv('https://raw.githubusercontent.com/rfordatascience/tidytuesday/master/data/2024/2024-07-23/songs.csv' , encoding= 'unicode_escape' )5 )
0
Season_01
20020618_top_30_group_1
1
Tamyra Gray
And I Am Telling You I'm Not Going
Jennifer Holliday
NaN
Advanced (1st)
1
Season_01
20020618_top_30_group_1
2
Jim Verraros
When I Fall in Love
Doris Day
NaN
Advanced (3rd)
2
Season_01
20020618_top_30_group_1
3
Adriel Herrera
I'll Be
Edwin McCain
NaN
Eliminated
3
Season_01
20020618_top_30_group_1
4
Rodesia Eaves
Daydream Believer
The Monkees
NaN
Eliminated
4
Season_01
20020618_top_30_group_1
5
Natalie Burge
Crazy
Patsy Cline
NaN
Eliminated
Data cleaning - Fix dtype
# Change 'season' column in songs dataset to int for joins with other datasets = []for row in songs_df['season' ]:= row.replace('Season' , '' ).replace('_0' , '' ).replace('_' , '' )'season' ] = seasons_reformat_list'season' ] = songs_df['season' ].astype(int )5 )
0
1
20020618_top_30_group_1
1
Tamyra Gray
And I Am Telling You I'm Not Going
Jennifer Holliday
NaN
Advanced (1st)
1
1
20020618_top_30_group_1
2
Jim Verraros
When I Fall in Love
Doris Day
NaN
Advanced (3rd)
2
1
20020618_top_30_group_1
3
Adriel Herrera
I'll Be
Edwin McCain
NaN
Eliminated
3
1
20020618_top_30_group_1
4
Rodesia Eaves
Daydream Believer
The Monkees
NaN
Eliminated
4
1
20020618_top_30_group_1
5
Natalie Burge
Crazy
Patsy Cline
NaN
Eliminated
Exploratory Data Analysis
from plotnine import (
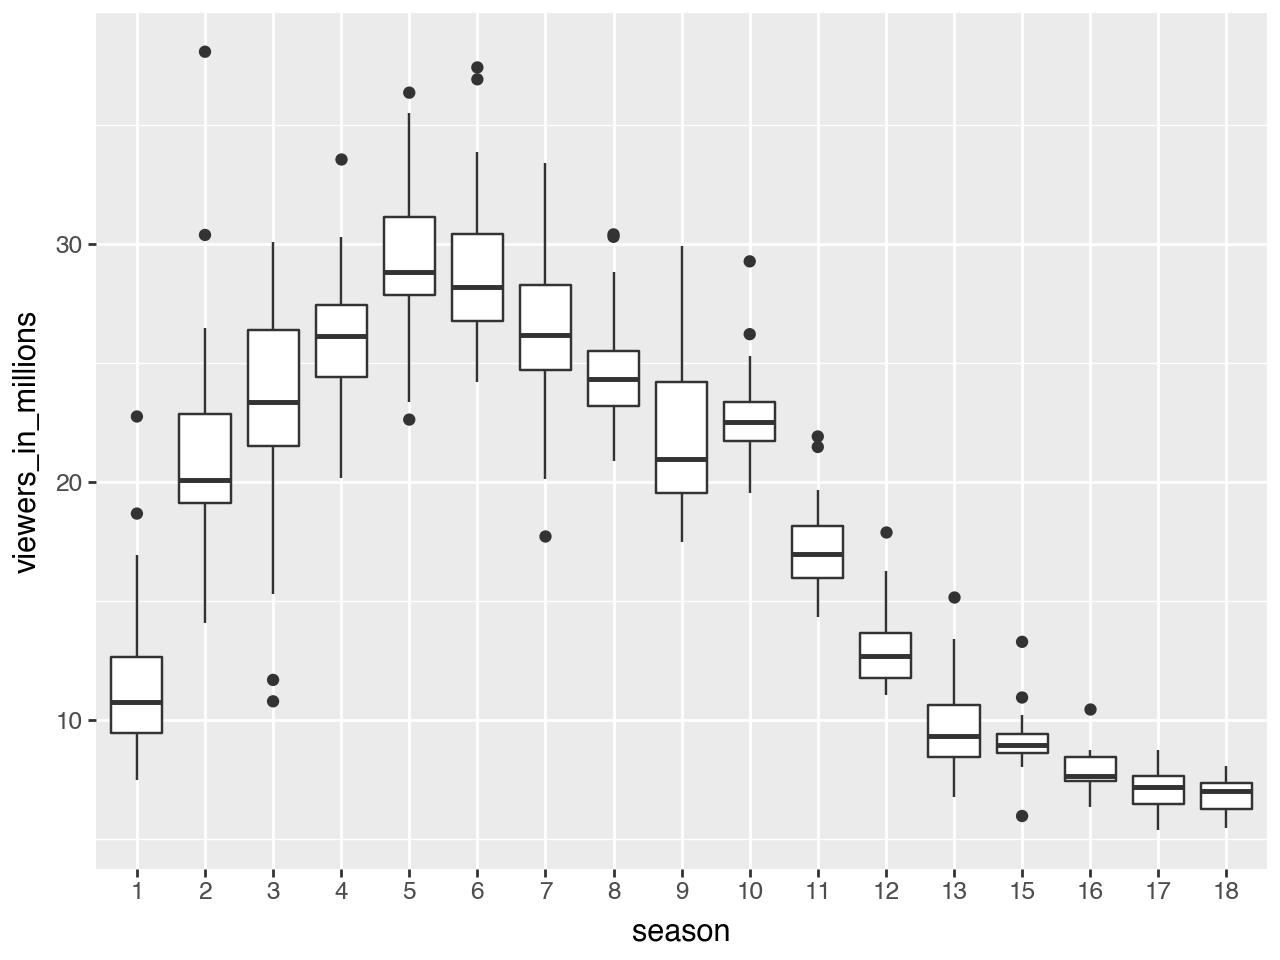
Raw boxplot viewers by seasons
= ratings_df['season' ].unique().tolist()+ geom_boxplot(aes(x= "factor(season)" , y= "viewers_in_millions" ))+ scale_x_discrete(labels= seasons, name= "season" ) # change ticks labels on OX
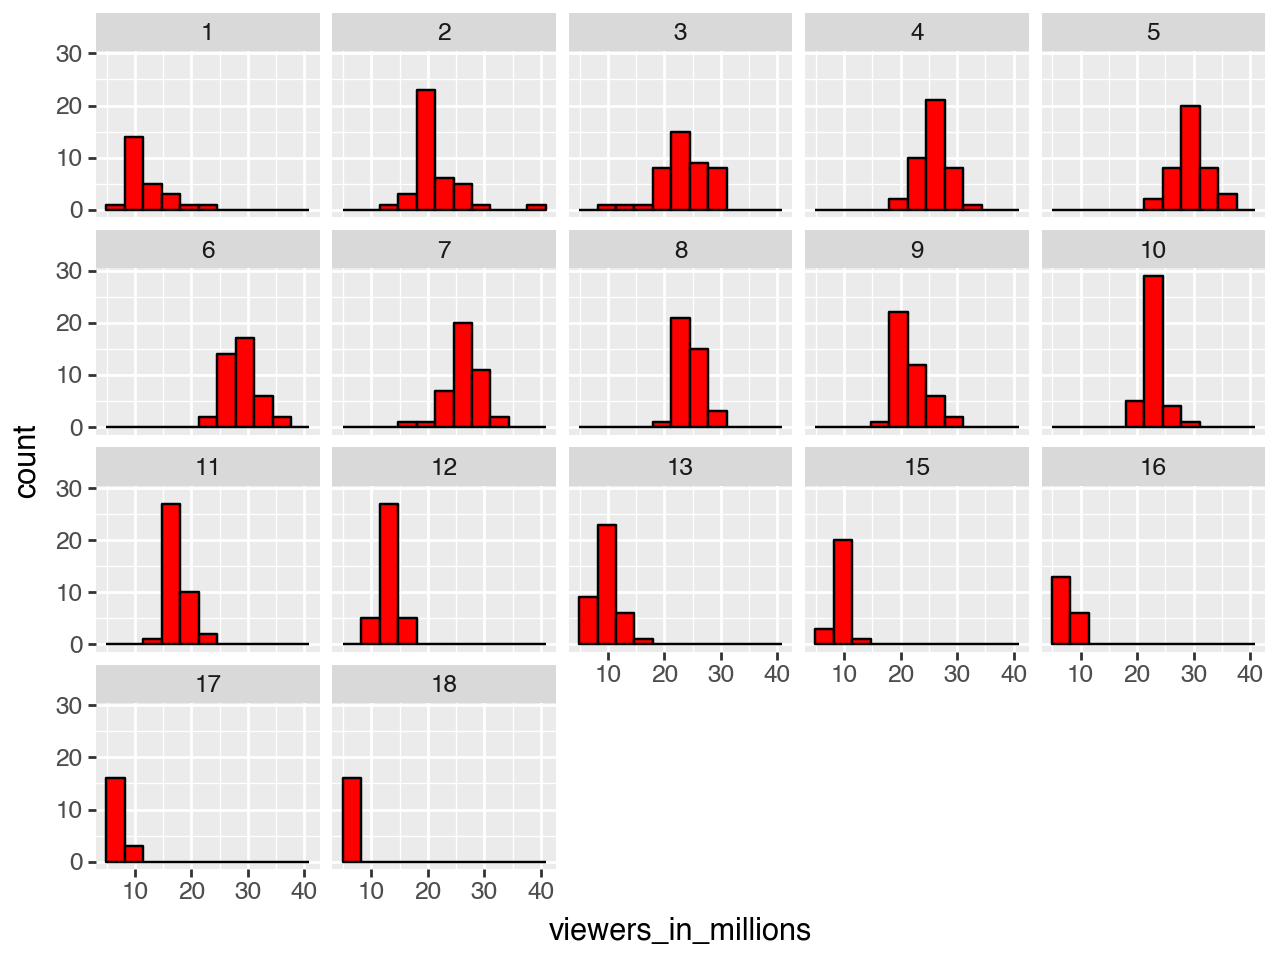
Histogram - Viewers by Season
= ratings_df[['season' , 'viewers_in_millions' , '18_49_rating_share' ]]+ geom_histogram(aes(x= "viewers_in_millions" ), fill= 'red' , colour= 'black' )+ facet_wrap("season" )
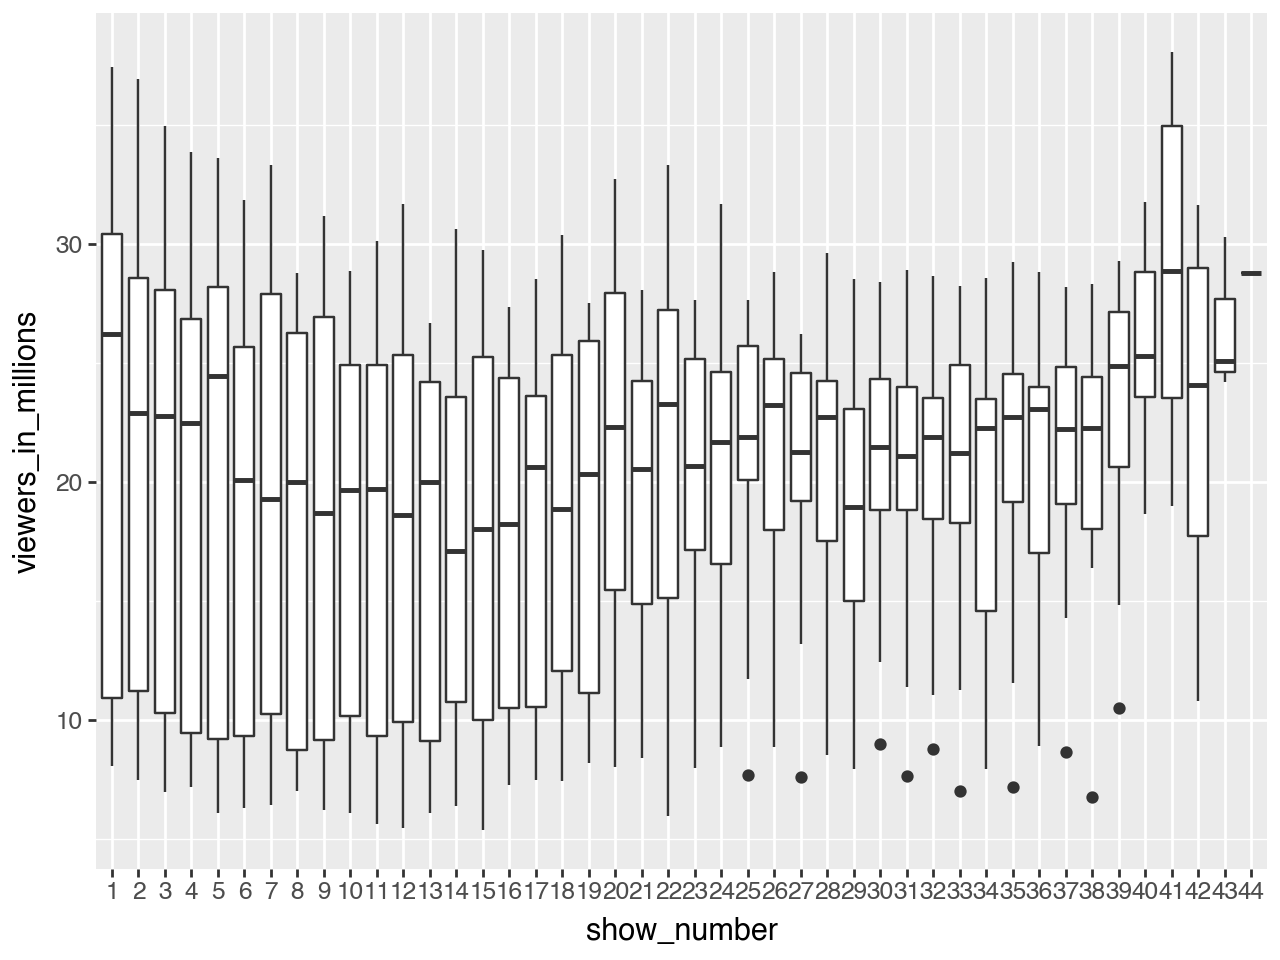
Raw boxplot viewers by show number
= ratings_df['show_number' ].unique().tolist()+ geom_boxplot(aes(x= "factor(show_number)" , y= "viewers_in_millions" ))+ scale_x_discrete(labels= show_number, name= "show_number" ) # change ticks labels on OX
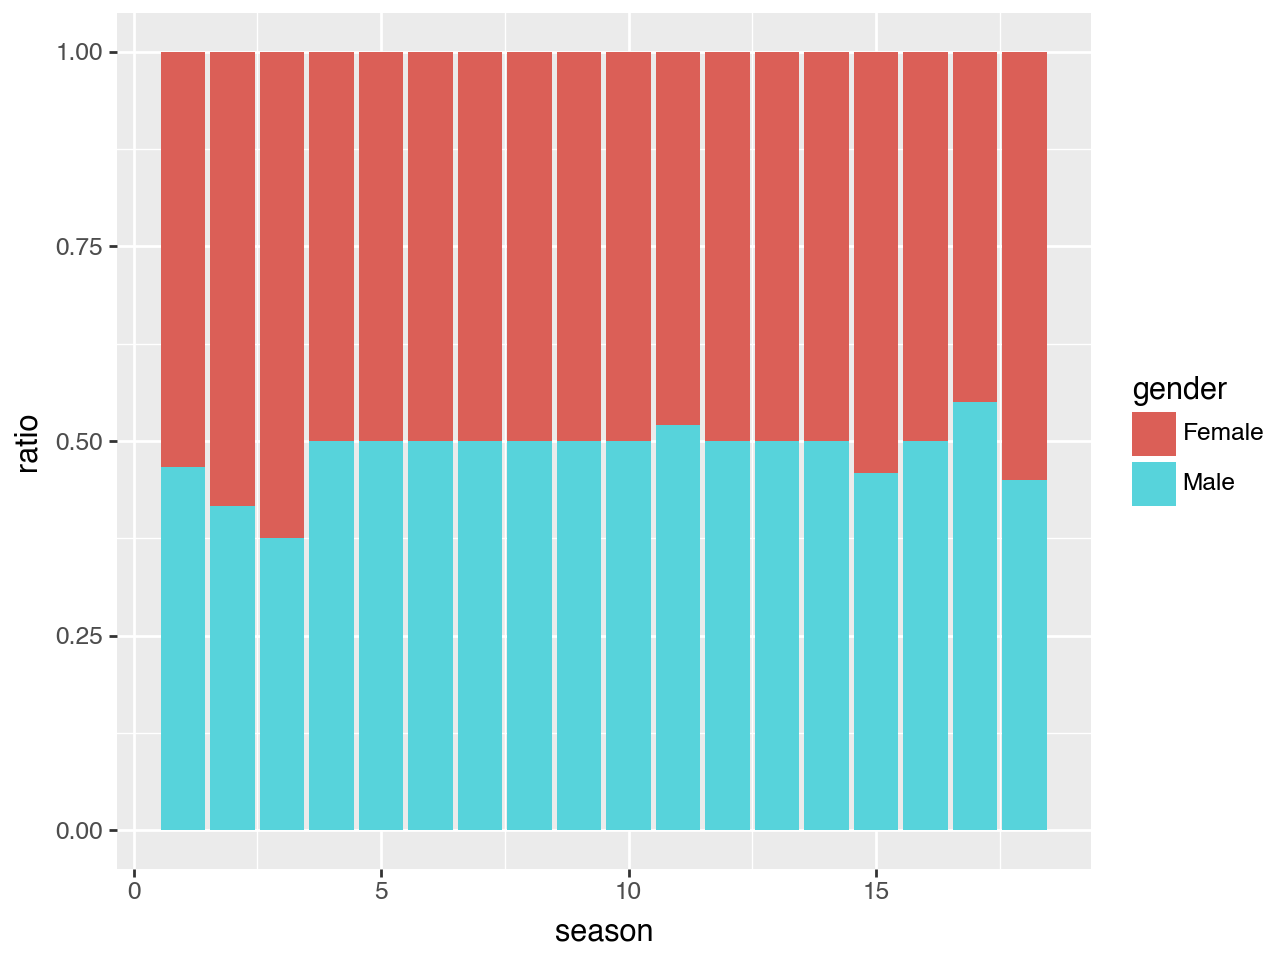
Gender contestants by season
= eliminations_df[eliminations_df['gender' ] == 'Male' ].groupby('season' ).count()['contestant' ].reset_index().rename(columns= {'contestant' : 'male_contestants' })# male_contestants_season['gender'] = 'Male' = eliminations_df[eliminations_df['gender' ] == 'Female' ].groupby('season' ).count()['contestant' ].reset_index().rename(columns= {'contestant' : 'female_contestants' })# female_contestants_season['gender'] = 'Female' = male_contestants_season.merge(female_contestants_season, on= 'season' )'total_contestants' ] = contestants['male_contestants' ] + contestants['female_contestants' ]'male_ratio' ] = contestants['male_contestants' ] / contestants['total_contestants' ]'female_ratio' ] = contestants['female_contestants' ] / contestants['total_contestants' ]= contestants[['season' , 'male_contestants' , 'male_ratio' ]].rename(columns= {'male_contestants' : 'contestants' , 'male_ratio' : 'ratio' })'gender' ] = 'Male' = contestants[['season' , 'female_contestants' , 'female_ratio' ]].rename(columns= {'female_contestants' : 'contestants' , 'female_ratio' : 'ratio' })'gender' ] = 'Female' = pd.concat([male_contestants, female_contestants])
0
1
14
0.466667
Male
1
2
15
0.416667
Male
2
3
12
0.375000
Male
3
4
12
0.500000
Male
4
5
12
0.500000
Male
5
6
12
0.500000
Male
6
7
12
0.500000
Male
7
8
18
0.500000
Male
8
9
12
0.500000
Male
9
10
12
0.500000
Male
10
11
13
0.520000
Male
11
12
10
0.500000
Male
12
13
10
0.500000
Male
13
14
12
0.500000
Male
14
15
11
0.458333
Male
15
16
12
0.500000
Male
16
17
11
0.550000
Male
17
18
9
0.450000
Male
0
1
16
0.533333
Female
1
2
21
0.583333
Female
2
3
20
0.625000
Female
3
4
12
0.500000
Female
4
5
12
0.500000
Female
5
6
12
0.500000
Female
6
7
12
0.500000
Female
7
8
18
0.500000
Female
8
9
12
0.500000
Female
9
10
12
0.500000
Female
10
11
12
0.480000
Female
11
12
10
0.500000
Female
12
13
10
0.500000
Female
13
14
12
0.500000
Female
14
15
13
0.541667
Female
15
16
12
0.500000
Female
16
17
9
0.450000
Female
17
18
11
0.550000
Female
Plot Gender Ratio
= "season" , y= "ratio" , fill= "gender" ))+ geom_bar(stat= "identity" )
Merge & split datasets, encode categorical variables and select features
Question: Can predict the winner using the features gender, viewers_in_millions, tickets_to_hollywood, and audition city?
# Merge the dataframes = pd.merge(auditions_df, eliminations_df, on= 'season' , how= 'left' )= pd.merge(merged_df, finalists_df, left_on= ['season' , 'contestant' ], right_on= ['Season' , 'Contestant' ], how= 'left' )= pd.merge(merged_df, ratings_df, on= 'season' , how= 'left' )= pd.merge(merged_df, seasons_df, on= 'season' , how= 'left' )= pd.merge(merged_df, songs_df, on= ['season' , 'contestant' ], how= 'left' )# Handle missing values 0 , inplace= True )# Feature selection = merged_df[['gender' , 'viewers_in_millions' , 'winner' , 'audition_city' , 'tickets_to_hollywood' ]].drop_duplicates()# Encoding categorical variables = {}= merged_df.select_dtypes(include= ['object' ]).columnsfor column in categorical_columns:= LabelEncoder()= le.fit_transform(merged_df[column].astype(str ))= le# Defining the target variable and features # Assuming 'winner' column in seasons_df as target = 'winner' = merged_df.columns.difference([target])= merged_df[features]= merged_df[target]# Splitting the data into training and testing sets = train_test_split(X, y, test_size= 0.2 , random_state= 42 )
Random Forest Classifier
from sklearn.ensemble import RandomForestClassifier# Training the model = RandomForestClassifier(n_estimators= 100 , random_state= 42 )# Making predictions = model.predict(X_test)# Evaluating the model = accuracy_score(y_test, y_pred)= classification_report(y_test, y_pred, output_dict= True )print ("Accuracy:" , accuracy)print ("Classification Report:" , classification_report(y_test, y_pred))
Accuracy: 0.9828503843879361
Classification Report:               precision    recall  f1-score   support

           0       0.98      1.00      0.99        94
           1       1.00      0.98      0.99       108
           2       1.00      0.98      0.99       110
           3       1.00      1.00      1.00       126
           4       1.00      1.00      1.00        96
           5       0.98      1.00      0.99       109
           6       0.97      0.95      0.96       152
           7       1.00      1.00      1.00        71
           8       1.00      1.00      1.00       124
           9       0.86      0.86      0.86        36
          10       1.00      1.00      1.00       134
          11       0.72      0.90      0.80        31
          12       1.00      1.00      1.00         1
          13       1.00      1.00      1.00       114
          14       0.96      0.98      0.97       107
          15       1.00      0.98      0.99        98
          16       1.00      1.00      1.00       107
          17       0.99      0.93      0.96        73

    accuracy                           0.98      1691
   macro avg       0.97      0.98      0.97      1691
weighted avg       0.98      0.98      0.98      1691
Neural Network
from sklearn.neural_network import MLPClassifier# Training the neural network model = MLPClassifier(hidden_layer_sizes= (100 ,), max_iter= 1000 , random_state= 42 )# Making predictions = nn_model.predict(X_test)# Evaluating the model = accuracy_score(y_test, y_pred)= classification_report(y_test, y_pred)print ("Accuracy:" , accuracy)print ("Classification Report:" , report)
Accuracy: 0.8675340035481963
Classification Report:               precision    recall  f1-score   support

           0       0.97      0.97      0.97        94
           1       0.95      0.97      0.96       108
           2       0.87      0.83      0.85       110
           3       0.79      0.82      0.80       126
           4       0.68      0.56      0.62        96
           5       0.89      0.93      0.91       109
           6       0.77      0.91      0.83       152
           7       0.97      0.96      0.96        71
           8       0.81      0.88      0.84       124
           9       0.54      0.19      0.29        36
          10       0.84      0.87      0.85       134
          11       0.46      0.52      0.48        31
          12       1.00      1.00      1.00         1
          13       0.95      0.97      0.96       114
          14       0.94      0.90      0.92       107
          15       1.00      0.98      0.99        98
          16       0.98      0.97      0.98       107
          17       0.92      0.81      0.86        73

    accuracy                           0.87      1691
   macro avg       0.85      0.84      0.84      1691
weighted avg       0.86      0.87      0.86      1691
Logistic Regression
from sklearn.linear_model import LogisticRegression# Training the logistic regression model = LogisticRegression(max_iter= 1000 , random_state= 42 )# Making predictions = lr_model.predict(X_test)# Evaluating the model = accuracy_score(y_test, y_pred)= classification_report(y_test, y_pred)print ("Accuracy:" , accuracy)print ("Classification Report:" , report)
Accuracy: 0.5340035481963336
Classification Report:               precision    recall  f1-score   support

           0       0.61      0.81      0.69        94
           1       0.76      0.69      0.72       108
           2       0.34      0.36      0.35       110
           3       0.15      0.08      0.10       126
           4       0.33      0.16      0.21        96
           5       0.44      0.49      0.46       109
           6       0.71      0.98      0.83       152
           7       0.80      0.46      0.59        71
           8       0.41      0.52      0.46       124
           9       0.00      0.00      0.00        36
          10       0.47      0.62      0.54       134
          11       0.27      0.13      0.17        31
          12       0.00      0.00      0.00         1
          13       0.47      0.65      0.55       114
          14       0.43      0.15      0.22       107
          15       0.75      0.85      0.80        98
          16       0.54      0.70      0.61       107
          17       0.69      0.73      0.71        73

    accuracy                           0.53      1691
   macro avg       0.46      0.46      0.45      1691
weighted avg       0.50      0.53      0.50      1691
Conclusion
We trained 3 models to predict the American Idol winner using features: gender, viewers_in_millions, tickets_to_hollywood, and audition city. The three models we used were the random forest classifier, neural network, and logistic regression.
Accuracy Scores
Random forest classifier: 0.9828503843879361
Neural network: 0.8675340035481963
Logistic regression: 0.5340035481963336
The random classifier model had the greatest accuracy store, but such a high score might indicate that the model is overfitting.